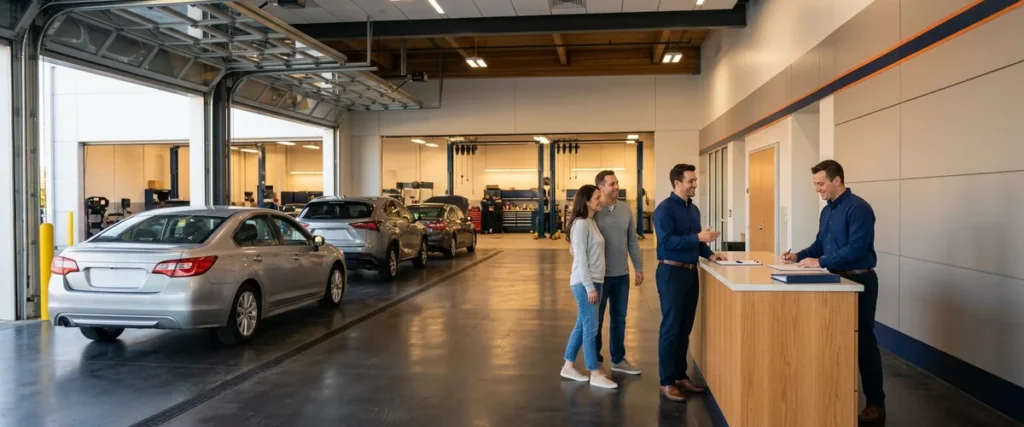

Help desk metrics for a dealership are the few numbers that show whether IT support actually works: time to reach a live person, first-contact resolution, reopen rate, resolution time by priority, and user satisfaction, reported monthly and by store.
Last updated: October 19, 2026
In Helion’s early years, we ran the help desk on feel. I knew the clients, I knew the techs, and I was pretty sure I knew how things were going. Then we grew, and it fell apart. Feel doesn’t scale. Metrics do.
I think about that every time a dealer principal tells me their IT support is “fine.” I don’t buy it. You read a financial statement every month, department by department, and you’d never accept “fine” from your service director or your controller. But the help desk, the people your whole staff calls when the DMS login fails or the F&I printer won’t print a contract, usually gets graded on whether anybody complained loudly this week. That’s a real problem, because the complaints you hear are the small share that made it all the way to your office.
So let’s fix that. This guide covers the handful of numbers worth asking for, what each one tells you, and what a bad trend looks like before it turns into a staff that’s quietly stopped calling. It applies to any provider, including our own managed IT support for dealerships. And it works just as well if your help desk is one in-house person with a phone. Same 5 numbers.
Which Help Desk Metrics a Dealer Principal Should Actually Track
Help desk metrics, sometimes called help desk KPIs or IT support metrics, measure how fast people get help, whether the fix holds, and how the people being helped feel about it. A dealership needs 5 of them, reported every month, broken out by store, with at least 6 months of trend beside each number.

Vendor software lists run to 15 or 20 KPIs. You don’t need 20. Five will do. Most of them are for the people running the help desk, not the people paying for it, and a report with 20 numbers on it is a report nobody reads past the first page.
| Metric | What it tells a dealer principal | What a bad trend looks like |
|---|---|---|
| Time to a live person | How long your staff waits before a human starts working the problem | The average holds steady while Saturday mornings and month-end get slower |
| First-contact resolution | The share of issues fixed on the first call, with no callback | It slides for 3 months in a row, or jumps suddenly while the reopen rate climbs |
| Reopen rate | Whether a “fixed” ticket stayed fixed | The same users and the same devices keep showing up |
| Resolution time by priority | How long a store-down problem takes compared with a one-person problem | Every ticket gets the same priority, so the number tells you nothing |
| User satisfaction | How your staff rates the help they got, right after they got it | Fewer people answer the survey, and the comments get shorter |
Each of those numbers can be made to look good on its own. Read together, they’re very hard to fake. So pair them.
Time to a Live Person
Every managed IT provider says they respond fast. Fast isn’t a number. 82 seconds is. That’s our average time to reach a support agent, and we publish it that way on purpose. In a lot of contracts, “response time” means the automatic email that says your ticket was received. The clock stops there. Your service advisor is still standing at the write-up station with a customer waiting.
Ask for time to a human. Not time to an email. Get the average, and get the slowest calls too, because averages hide things. Saturday mornings and the last few days of the month are when dealerships call the most, and they’re often when help desks have the fewest people on the phones.
Hours matter as well. Ours run live from 6 a.m. to midnight Eastern, Monday through Saturday. After-hours, weekend, and field support are included at no extra charge. Whatever your provider’s hours are, the report should show calls by hour of day. Then you can see what happens to the store that opens at 7.
It’s actual people, picking up. That’s what you’re paying for. Here’s how our dealership IT help desk is set up.
First-Contact Resolution
First-contact resolution is the share of issues fixed during the first call, chat, or ticket, without anybody calling back. Think password resets and stuck print queues. A good dealership help desk closes most of those while the person is still on the line. Some days that’s the whole job.

Callbacks cost you. Every one can mean a salesperson leaving a customer twice instead of once. SQM Group, which has benchmarked call centers for years, reports in its first call resolution business case that every 1% improvement in first-contact resolution comes with a 1% improvement in customer satisfaction. That research is from call centers, not dealership IT, but anybody who has watched a finance manager wait on a second callback in the middle of a deal will believe it. I do.
Some problems can’t be fixed on the first contact. That’s normal. A failed switch, a bad cable run in the service drive, or a dead circuit needs hands in the building, which is a different job we covered in when a dealership needs onsite IT support. The help desk should log those honestly as escalations, not count them as misses and not hide them either.
The trap is a first-contact number that looks too good. Techs can close a ticket on the call, tell the user to reboot, and move on. Which is why you never read this number without the next one.
Reopen Rate and Repeat Tickets
The reopen rate is the percentage of resolved tickets that come back, either reopened or filed again for the same problem. It’s the honesty check on everything else in the report. Watch it closely. If first-contact resolution climbs and the reopen rate climbs with it, somebody is closing tickets, not fixing problems.
I’d also ask for a list of the top 10 repeat issues each month, by store. That list tells you more than any percentage. When the same scanner in the parts department or the same login at the BDC shows up 4 weeks running, nobody owns the cause. Who owns that? A good help desk hands those to someone whose job is to find out why it keeps happening, which is the work of root cause analysis for dealership IT problems.
We’ve already seen this exact problem across 2,000-plus dealerships, and the pattern is always the same. Staff stop calling about the things that keep breaking. They work around them. The ticket count goes down, the report looks better, and the dealership is worse off.
Low ticket volume isn’t always good news.
Resolution Time by Priority
Average resolution time across all tickets is close to useless for a dealer principal. It mixes a request for a new email signature with a store that can’t open repair orders, and the average of those two things describes neither of them.
Ask for resolution time split by priority, and ask how priority gets assigned. A dealership help desk should treat a whole department down, a DMS outage at one store, or a card terminal problem on a busy Saturday very differently from one user’s slow laptop. If nearly every ticket on the report carries the same priority, the help desk isn’t triaging. It’s queuing.
One more thing on this. I wouldn’t ask a provider to promise you a fixed resolution time for every kind of problem, because nobody can honestly do that for a failed circuit or a vendor’s outage. What you want is the real number, by priority, trended over time, with the outliers explained in plain English.
Satisfaction, Asked the Right Way
User satisfaction is the one metric that comes from your people instead of the help desk’s own system, which is why it belongs in the report. The usual method is a short survey sent right after a ticket closes. Microsoft describes the standard customer satisfaction (CSAT) score as a rating on a 1 to 5 scale, and that’s a fine format for a dealership. One question. One click. Room for a comment.
Watch the response rate as closely as the score. It’s an early warning. When people stop answering the survey, they’ve usually stopped expecting anything to change. And read the comments, because a 4 out of 5 with “took two calls” written next to it tells you something the score doesn’t.
There’s a public version of this number too. Helion holds a 4.9 out of 5 rating on Google across more than 200 reviews, written by the dealership staff we support, and anybody can read them. A provider’s private survey score should look something like its public reputation. If the two don’t match, ask why.
What a Good Monthly Help Desk Report Looks Like
A good report fits on 2 pages. No more. It answers one question: is support getting better or worse at each store? Here’s what I’d want on it if I were signing the check.
- The 5 numbers above, each with a 6-month trend line next to it, not this month alone.
- Every number broken out by store, because a group average can hide one rooftop that’s struggling.
- Tickets per employee. The average franchised dealership had 65 employees in 2025, according to NADA Data 2025, and comparing a 40-person store with a 120-person store on raw ticket counts is comparing two different businesses.
- The top 10 repeat issues and who owns each one.
- A short note, in plain English, on anything that went wrong and what changed because of it.
To be fair to the help desks out there, numbers can be gamed, and I’m not telling you to manage your IT provider by spreadsheet. The point of the report is the conversation it starts. If your provider can’t produce these numbers, or produces them and can’t explain the bad months, you’ve learned something important about who’s running your support. That’s worth knowing. And if your help desk is an in-house team, or a co-managed IT arrangement where your IT person shares the work with a provider, the same report keeps everybody honest with no finger-pointing about whose tickets are whose.
The long-run number is the one that sums up all the others. Our client retention rate is 98%. That’s the scoreboard. Dealers don’t stay with a help desk for years because of one good month.
What Dealer Principals Ask Us About Help Desk Numbers
Is “average response time” the same as time to a live person?
Realistically, what first-contact resolution rate should we expect?
How often should a dealer principal see these numbers?
Our help desk is one in-house IT person. Do these metrics still apply?
If you could only watch one number, which would it be?
Can a provider game these numbers?
Feel Doesn’t Scale
I learned that one the hard way, running our own help desk on instinct until it stopped working. Your dealership is no different. Nobody’s is. If nobody can show you, store by store, how fast your people reach help and whether the fix holds, you’re running IT support on feel, and you’ll find out how it’s really going from the employees who quit calling.
If you want to see where your support stands today, start with a complimentary IT and cybersecurity assessment. We’ll look at how your help desk is measured now and what your staff actually experiences. Then you’ll have numbers instead of a feeling.